Stack Test Failure on Your Regenerative Thermal Oxidizer? What’s the Next Step?
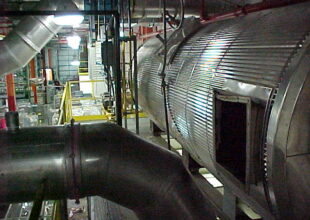
.jpg)
RTO Failure? What's Next?
Determining the reason for the failure is easiest while the stack testing firm is still on site! They have the instrumentation needed to troubleshoot and identify many of the potential reasons for the failure. This post provides a guide to help you determine the source of the failure.
Exhaust stack test failures happen, and they are not pleasant to experience. Some common causes of stack test failures are:
- Regenerative thermal oxidizer (RTO) performance
- Process conditions
- Stack test performance
- Operating air permit
Your Best Troubleshooting Tool? A Graph!
A graph of test data can help isolate the breakdown in performance to a specific area of the machine. Look at the graph first. Then follow the guidelines below to isolate, identify, and correct any equipment related problem.
Properly Operating RTO
Figure 1 shows a graph of RTO stack emissions test data from a properly operating RTO. This graph can be used as a baseline for comparison to a graph of your exhaust stack test data.
Regenerative Thermal Oxidizer Emissions Testing – Low VOC Concentration Condition
Well Tuned – Properly Operating RTO
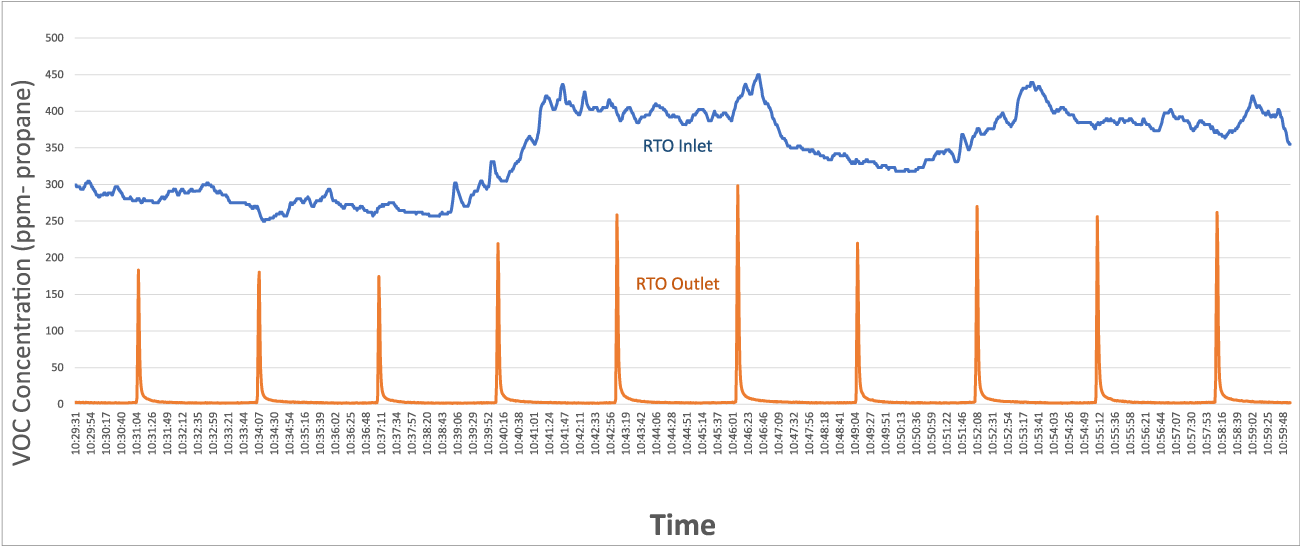
Graph Characteristics of a Properly Operating RTO
You should expect to see a consistent VOC concentration at the RTO outlet (orange line) with periodic, very tight spikes in concentration These are VOC concentration spikes that occur during a poppet valve or rotary valve switch. The spike has a nearly vertical rise, then a nearly vertical drop with a tail at the end as it drops back down. Between these valve switches you should see a consistent, low VOC concentration in the RTO exhaust. Likely under 10 ppm. Graphing your stack test data is extremely helpful for troubleshooting a stack test failure.
Is the Failure Due to RTO Performance?
Poppet Valves/Rotary Valves
Valve Sealing: Regenerative thermal oxidizers (RTOs) incorporate poppet valves or rotary valves to change airflow direction through the RTO. Poppet valves can leak, either by seating improperly, or the metal disk itself may crack due to wear. The leakage that results is the most common source of RTO performance loss during a stack test. Also, sealing air in a rotary valve RTO can fail. These issues can best be avoided by performing a thorough RTO inspection prior to an RTO stack test.
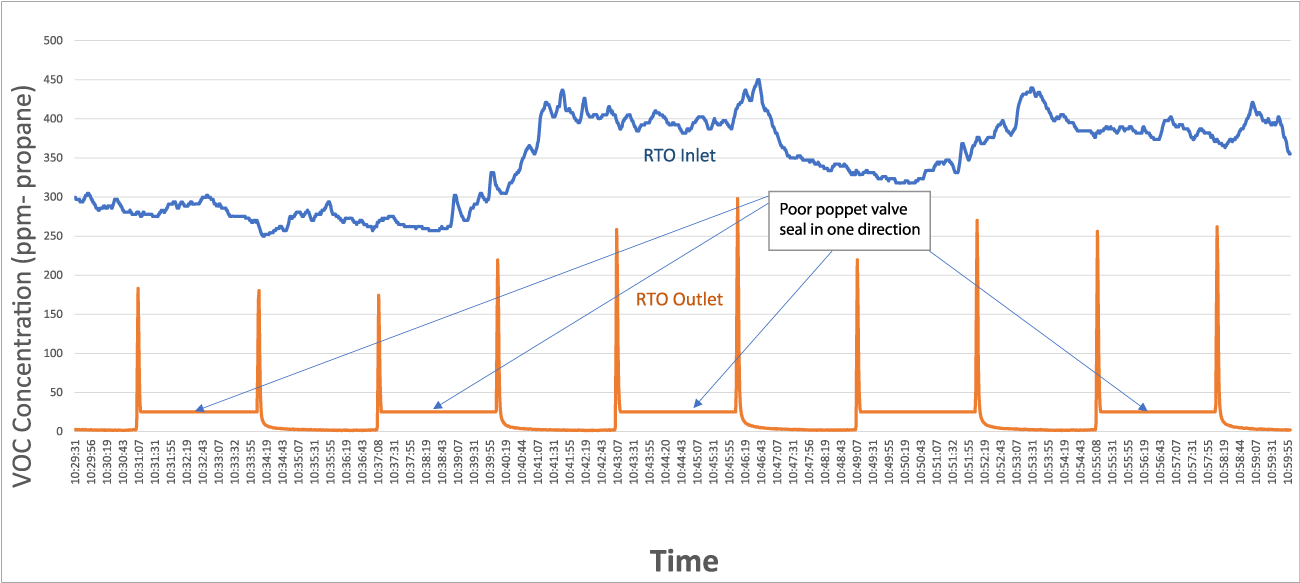
To determine if valve leakage is the potential problem, compare the exhaust stack VOC concentration in both flow directions. Compare the performance when operating in one flow direction (poppet A inlet/poppet B outlet) to the performance when operating in the other flow direction (poppet A exhaust/Poppet B inlet). If different by significant degree (i.e. 15 ppm v. 6 ppm) something is likely wrong with the poppet disks or the poppet valve actuators. A properly operating RTO will have nearly matching exhaust stack ppm levels in both flow directions (assuming unchanging inlet VOC concentration). Figure 2 is a graph of an RTO experiencing valve leakage. Comparing this graph to Figure 1 shows an increase in stack VOC concentration in one half of the valve cycle.
Regenerative Thermal Oxidizer Emissions Testing – What Might Be Wrong?
Example of a Poorly Sealing Poppet Disk
Valve Actuation: Review a graph of the exhaust stack ppm levels measured during your RTO emission test. Look particularly at the spike in VOC concentration in the exhaust stack. The shape of the graph will help identify another possible culprit. When an RTO switches flow direction it will back-flush un-converted VOCs to the exhaust stack. This slug of un-converted VOCs shows up as a spike in exhaust concentration that then drops off quickly in a properly operating RTO. If the drop off is not sharp, there may be a poppet actuation problem. For example the poppet may be traveling too slow. The actuation of the poppet valve (air cylinder/solenoid valve/compressed air source/moisture in air/proximity switch) must be investigated to determine the cause. For an example see Figure 3 in comparison to Figure 1.
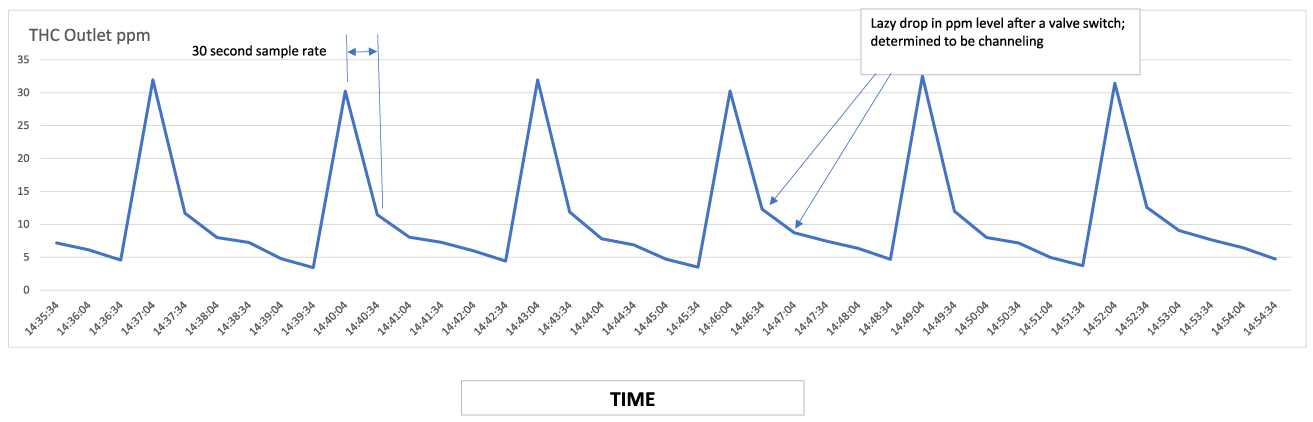
Figure 3 shows a graph that is either experiencing a slow actuating poppet valve or a ceramic media channeling issue. Notice the slow drop off in ppm levels following a valve switch. Comparing this graph to Figure 1 will show there is something wrong. The exhaust stack VOC concentration should drop to single digit ppm levels within 5-10 seconds of a valve switch. In this graph you can see that the ppm level drops off very slowly. This lazy drop off can be the result of slow-moving poppet valves, or poor sealing of the rotary valve, or possibly channeling through the ceramic media bed (see Ceramic Media Beds section). Inspect poppet valve operation or measure rotary valve seal air supply flow to determine if that is the issue. If not, it may be a ceramic media bed issue.
Figure 3 explanation: Troubleshooting was made more difficult for this particular test because the test protocol was using an incorrect sampling rate (see Test Protocol section below). A faster sampling rate would have refined the graph helping pinpoint the issue more quickly.
Regenerative Thermal Oxidizer Emissions Testing – 30 Second Sampling Rate
** Poor Sampling Rate – made it difficult to troubleshoot the reason for poor RTO performance
Is the Failure Due to Other Equipment Related Issues?
Ceramic Media Beds
Channeling of air through the beds can result in poor VOC destruction. This channeling may be due to collapse of structured ceramic media. Or it could be due to media plugging from particulate, which accelerates air through a reduced bed flow area. When the bed is fouled/damaged enough it can reduce heat exchanger performance such that VOC destruction performance drops off. The air passing through the “channels” of the beds may not reach the needed temperature for VOC destruction before exiting the RTO. An example of this condition is represented in Figure 3.
Unfortunately, this problem cannot be isolated (identified) using the stack test equipment. This determination would require cooling the unit off for personnel entry to inspect the ceramic media beds. It is for this reason we recommend an RTO inspection prior to performing a formal stack test.
Burner
Poor burner performance can result in high methane levels in the exhaust concentration (when combined with other negative factors: i.e. ceramic media bed fouling). Inspect the flame for poor quality (i.e. lazy flame, yellow/orange), and adjust the burner settings if needed to see if this improves the VOC concentration in the exhaust.
RTO Design
A properly operating RTO performs best at 50-90% of its airflow capacity. The risks of operating near 100% or below 50% during an exhaust stack test are explained below.
Low Flow Condition: Operating at the low end of the RTO airflow capacity (25% of capacity) can cause difficulty meeting high VOC destruction targets during your RTO emission test. An RTO achieves very high fuel efficiency by switching the flow direction every 3 minutes, typically. The volume of dirty air exhausted on each valve switch is a fixed amount of air. At the lower flow rate the spike volume is a higher percentage of the treated airflow than when operating at 50-90% capacity. This depresses VOC destruction efficiency. To combat this, extending the switch time to more than 3 minutes will help push the VOC destruction performance up a fraction. Or, operating with a higher airflow (50-90% of capacity) could also provide slightly higher performance than at low flow conditions.
High Flow Condition (some RTOs): On the other hand, some RTO designs are built with little safety margin. An RTO that fits this description may perform well at 50-80% of its capacity, but poorly at 100% of its capacity. RTOs with little design safety margin will be negatively impacted by any hiccup or plugging, or parameter tuning issue. In these systems, any performance issue will have an exaggerated impact on VOC destruction performance. Problems such as plugging of ceramic media, poor burner operation or a too-short residence time will degrade performance of these RTOs quickly. Choosing a quality-built RTO that has some safety margin left at 100% capacity is key to a successful stack test (and a long life RTO).
Is the Failure Due to Process Conditions?
As a rule of thumb, when the inlet VOC concentration increases, the VOC destruction performance of an RTO will also increase. Note: This is on a percentage basis. An RTO with a 1500 ppm VOC concentration at the RTO inlet will perform better than the same RTO operating with a 750 ppm VOC concentration. The reason for this is that the RTO cannot remove all VOCs but will have a “floor” of around 2-12 ppm VOC in the exhaust when treating most VOC concentrations. The denominator in the equation, then, has much influence on the calculation:
VOC Destruction efficiency (750 ppm inlet; 6 ppm outlet) = 1- (6 ppm exhaust/750 ppm inlet)= 99.1%
So, if an RTO is borderline in meeting its performance target, an increase in the inlet concentration may provide the performance boost needed. Steady state conditions with medium to high VOC concentrations are the ideal conditions for stack test success. For example, in Figure 1 the inlet ppm level is only 280 ppm on average. The average stack outlet (cleaned air) concentration is 5.5 ppm, resulting in 98.0% VOC destruction. This same RTO when operated with an inlet ppm of 600 ppm provided 98.4% VOC destruction.
Is the Failure Due to Stack Test Performance?
Instrumentation
Is the instrumentation capable of measuring the low VOC concentration expected at the outlet of the RTO? An RTO or thermal oxidizer will typically have a VOC concentration in the exhaust in single digit parts per million (ppm). The expected concentration is important for the stack testing firm to be aware of so they can plan for the best stack test method and calibration gas needed. Check out the basics that go into stack testing methods at this link: EPA stack testing guidance - basics.
Test Equipment
All of the above points assume that the test equipment is performing properly. Common testing equipment issues could include cracks/leaks in the sensing lines, or build-up in the sensing lines due to insufficient heating of the sensing lines in an application with condensable VOCs. Other, less frequent, issues might be bad calibration gas, or improper zeroing of the instrumentation. Reputable testing firms troubleshoot their equipment as part of their test set-up protocol. So, all of these are very uncommon, but have happened. Once determined as a problem, all of these test equipment issues can typically be corrected quickly.
Test Protocol
One other difficulty we have seen is insufficient frequency of sampling/recording of the ppm level. An RTO, by its very design, has spikes in the exhaust stack ppm level once every 2-3 minutes, but steady state levels under 10 ppm during the remainder of the 2-3 minute cycle. See Figure 1. These peaks must be captured by the sensing equipment and integrated over time to determine an average VOC concentration over the full cycle and over the full test period (usually 3 one-hour tests). Sensing frequency should be once (or more) per second. We have seen situations where the recording frequency was every 30 seconds (see Figure 3). This will result in faulty performance values, and possibly a failed stack test. On top of that, the data is insufficient to allow troubleshooting of a problem during a stack test. A good practice is to request the stack testing protocol from your testing firm well before the test takes place. Have your RTO OEM review it to make sure it factors in the unique nature and operation of an RTO system. Or send it to us and we can review it for you as well. Knowing the process and RTO inlet/outlet conditions will allow the stack testing firm to develop the best stack test protocol for the project.
Is the Failure Due to the Operating Air Permit?
Was the air permit written in such a way that failure is nearly guaranteed? This happens very rarely, but it does happen. An experienced, vetted environmental consultant is the key to avoiding this. We have seen where the permit does not factor in the full range of possible VOC concentrations. Extremely light VOC concentrations will make achieving 99+% VOC destruction difficult with a standard RTO. For those conditions special RTO features may be required to reach 99+% VOC destruction. these features may not be needed when that light VOC concentration airstream always mixes with another high VOC concentration airstream. The combined mixed airstream may be easily treated by a standard 2 bed RTO. But if the high VOC concentration stream drops off-line during normal operation (and for our focus, during the stack test), then meeting a high VOC destruction efficiency would not be possible with a standard 2 bed RTO. The permit parameters should factor in these swings in conditions and specify the RTO accordingly at the outset of the project, but also the stack test protocol must be structured for these conditions as well. Steady state test conditions are not always possible during a stack test, but precautions should be taken to ensure the RTO is designed for actual process condition swings so the RTO meets VOC destruction targets, and also that the test protocol factors in all process conditions.
Other Considerations:
3+ Chamber RTOs
There are additional considerations for RTOs with a puff capture or an RTO with 3 or more heat recovery chambers. The spike in VOC concentration during a valve switch (Figure 1) in these systems will be significantly less than 2 chamber (bed) RTOs, but the troubleshooting methodology will be the same. Also, over-exhausting to the puff chamber or purge chamber will diminish the RTO VOC destruction performance because VOCs will “Spill over” to the exhaust stack at the end of a cycle. To identify this, look for an upswing in VOC concentration just before a valve switch. Also, due to the increased number of valves, troubleshooting will be a bit more tedious in these systems. But by process of elimination, and good graphs of VOC concentration the culprit can be found using the same methods as those provided for two chamber RTOs.
Industry Specific Considerations
Heated sample lines are a must for airstreams with highly condensable VOCs. Also, some applications run the risk of re-volatilization of condensable build-up on the cold face. In these cases, performing a bake out just prior to the stack test is recommended. Industries needing speciation (itemization) of VOC constituents under their permit should perform due diligence in selecting a testing firm familiar with the need, and the specific application.
Trouble With a Catalytic Oxidizer or Thermal Oxidizer?
Stack test failures on catalytic and thermal recuperative oxidizers are less complicated to troubleshoot than for an RTO. Stack testing equipment is very beneficial for this effort. The culprit in these systems is either the heat exchanger, the catalyst bed, or the burner tuning. Simply sample the airstream and see where the drop off in performance occurs. Sampling can be done throughout the catalytic oxidizer or thermal oxidizer to pinpoint the drop off in performance. Check the VOC concentration before and after the heat exchanger cold side, before and after the heat exchanger hot side, before and after the catalyst bed. No temperature rise or a significantly lower-than-historic temperature rise across the catalyst bed is a sign of a catalyst bed performance issue. The source of the failure in a catalytic or thermal oxidizer will usually be easy to determine using the test equipment.
Conclusion
The majority of stack testing issues we have seen over the years are the result of equipment operation, with only a sprinkling of problems tied to exhaust stack testing methods or permit issues. So, start with the RTO-related guidance provided above and then if all avenues are exhausted, consider the testing and permit related guidance we have provided. We are not experts in stack testing, nor permit preparation. Our experience with testing firms and consultants around the world has been exceptional, with only a few hiccups over the years. Those isolated hiccups did happen so we have included them in this blog as potential considerations, though rare.
If the above troubleshooting does not pinpoint the problem, contact our experts and we would be happy to help you find a solution.
DFTO & Catalytic Oxidizer Treating Emissions from Automotive Paint Line
Quick replacement of damaged thermal recuperative oxidizer after fire damage to the existing system. We kept them running with a stopgap & a final solution.